Box Plots
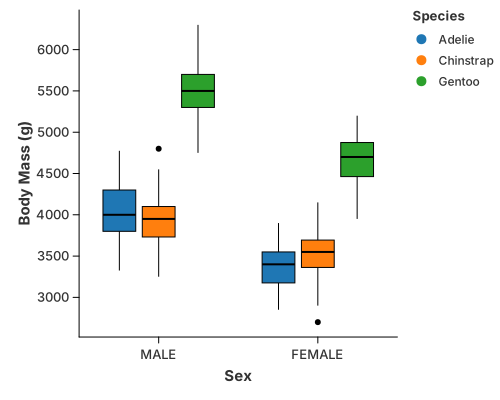
A box plot summarises a numeric column with its five-number summary — the minimum, the lower quartile, the median, the upper quartile and the maximum — plus any outliers. It is compact and precise about spread, at the cost of hiding the shape of the distribution.
Box plot
use charton::prelude::*;
use std::error::Error;

fn main() -> Result<(), Box<dyn Error>> {
    let ds = load_dataset("penguins")?;
    println!("{:?}", &ds);

    chart!(ds)?
        .mark_boxplot()?
        .encode((
            alt::x("Sex"),
            alt::y("Body Mass (g)"),
            alt::color("Species"),
        ))?
        .save("docs/src/images/grouped_boxplot.svg")?;

    Ok(())
}
mark_boxplot carries its own statistic, so no transform is needed: give it a
categorical x, a numeric y, and an optional color to group the boxes.
The composable quantile box
When you want the box as a layer rather than a finished chart,
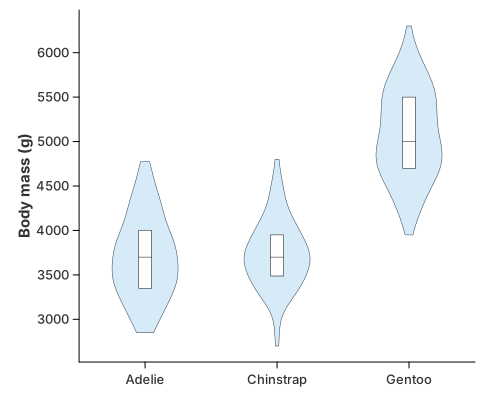
transform_quantile_box emits just the inter-quartile box and the median as an
ordinary polygon. It uses the same lane layout as transform_band, so the box
always sits exactly over its violin.
//! Violin with an inner box.
//!
//! The outline is `mark_violin`; the box is `transform_quantile_box`. They share
//! the same lane layout, so the box always sits exactly over its violin.

use charton::prelude::*;
use std::error::Error;

fn main() -> Result<(), Box<dyn Error>> {
    let penguins = load_dataset("penguins")?;

    let outline = chart!(&penguins)?
        .mark_violin()?
        .configure_violin(|mark| {
            mark.with_color("#d6eaf8")
                .with_opacity(1.0)
                .with_stroke("#2c3e50")
                .with_stroke_width(0.5)
        })
        .encode((alt::x("Species"), alt::y("Body Mass (g)")))?;

    let inner_box = chart!(&penguins)?
        .transform_quantile_box(
            QuantileBoxTransform::new("Body Mass (g)").with_category("Species"),
        )?
        .mark_polygon()?
        .configure_geoshape(|m| m.with_fill("white").with_stroke("black"))
        .encode((
            alt::x("x").with_category_labels("Species"),
            alt::y("y"),
            alt::path_group("path_group"),
        ))?;

    outline
        .and(inner_box)
        .with_x_label("")
        .with_y_label("Body mass (g)")
        .save("docs/src/images/violin_box.svg")?;

    println!("Saved docs/src/images/violin_box.svg");
    Ok(())
}
It emits a box_part column ("box" / "median") so the two polygons can be
styled differently, and copies the category / group columns back so the box
can be coloured and dodged like the outline it sits on.
Box on a violin
Because the box is just a layer, it stacks with .and(…) over any distribution
view — a plain violin, a dodged violin, or a full raincloud. See
Violin.
See also
- Violin — the outline form, and the raincloud that combines both.
- Transforms & Columns —
transform_quantile_boxcolumns.