Histogram
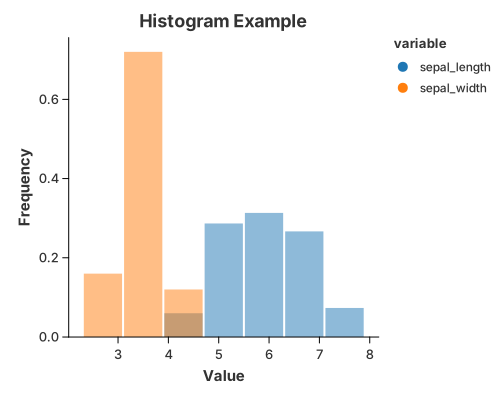
mark_hist bins a numeric column for you and draws the counts as bars — the
classic first look at a distribution. The bin count follows from the data unless
you set alt::x(...).with_bins(n).
use charton::prelude::*;
use std::error::Error;

fn main() -> Result<(), Box<dyn Error>> {
    let ds = load_dataset("iris")?;
    println!("{:?}", ds);

    let raw_sl = ds.get_column::<f64>("sepal_length")?;
    let raw_sw = ds.get_column::<f64>("sepal_width")?;

    let mut value = Vec::with_capacity(raw_sl.len() + 50);
    value.extend_from_slice(raw_sl);
    value.extend_from_slice(&raw_sw[0..50]);

    let mut variable = Vec::with_capacity(raw_sl.len() + 50);
    variable.extend(std::iter::repeat_n(
        "sepal_length".to_string(),
        raw_sl.len(),
    ));
    variable.extend(std::iter::repeat_n("sepal_width".to_string(), 50));

    // Create a histogram chart
    let histogram = chart!(value, variable)?
        .mark_hist()?
        .configure_hist(|h| {
            h.with_color("steelblue")
                .with_opacity(0.5)
                .with_stroke("black")
                .with_stroke_width(0.0)
        })
        .encode((
            alt::x("value"),
            alt::y("count").with_normalize(true),
            alt::color("variable"),
        ))?;

    histogram
        .with_size(500, 400)
        .with_title("Histogram Example")
        .with_x_label("Value")
        .with_y_label("Frequency")
        .configure_theme(|t| t.with_palette(ColorPalette::Tab10))
        .save("docs/src/images/histogram.svg")?;

    Ok(())
}
Add a color field to overlay several columns in one frame, and
alt::y("count").with_normalize(true) to read frequencies instead of raw counts.
See also
- 1-D Density — the smoothed version of the same picture.
- Bars, Ranges & Comparisons —
mark_barwhen you already have the counts.