Pie, Donut, Rose & Nightingale
All four are the same primitive: a bar on a polar coordinate system. Change the coordinate, the stacking and the angle, and the bar becomes a wedge, a ring, a petal or a polar-area chart. No pie-specific mark exists or is needed.
Pie
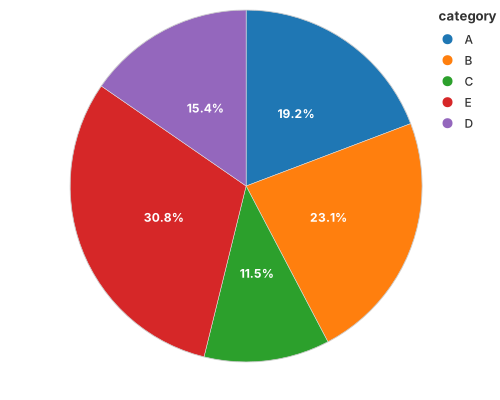
use charton::prelude::*;
use std::error::Error;

fn main() -> Result<(), Box<dyn Error>> {
    // Create sample data frame for donut chart
    let category = ["A", "B", "C", "E", "D", "E"];
    let value = [25.0, 30.0, 15.0, 30.0, 20.0, 10.0];

    // Create donut chart
    chart!(category, value)?
        .mark_bar()?
        .encode((
            alt::x(""),             // x encoding for donut chart (empty string for donut chart)
            alt::y("value"),        // theta encoding for donut slices
            alt::color("category"), // color encoding for different segments
        ))?
        .with_coord(CoordSystem::Polar)
        .save("docs/src/images/pie.svg")?;

    Ok(())
}
Donut
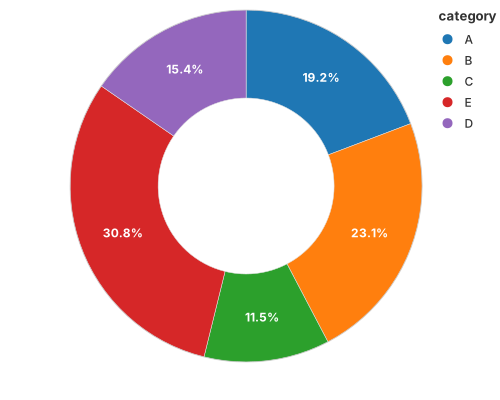
The same wedges with a hole: an inner radius on the polar coordinate.
use charton::prelude::*;
use std::error::Error;

fn main() -> Result<(), Box<dyn Error>> {
    // Create sample data frame for donut chart
    let category = ["A", "B", "C", "E", "D", "E"];
    let value = [25.0, 30.0, 15.0, 30.0, 20.0, 10.0];

    // Create donut chart
    let donut = chart!(category, value)?
        .mark_bar()?
        .encode((
            alt::x(""),             // x encoding for donut chart (empty string for donut chart)
            alt::y("value"),        // theta encoding for donut slices
            alt::color("category"), // color encoding for different segments
        ))?
        .with_coord(CoordSystem::Polar)
        .with_inner_radius(0.5);

    donut.save("docs/src/images/donut.svg")?;

    Ok(())
}
Rose (polar bar)
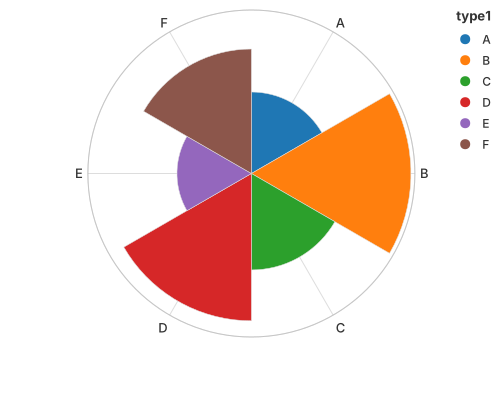
Bars whose height is a radius, arranged by angle.
use charton::prelude::*;
use std::error::Error;

fn main() -> Result<(), Box<dyn Error>> {
    // 1. Create a DataFrame with high-variance values to emphasize radial differences.
    // We use 6 categories ("A" through "F") to fill the polar coordinate space evenly.
    let type1 = ["A", "B", "C", "D", "E", "F"];
    // Data values range from 2.0 to 12.0 to create a clear "petal" effect
    let value = [3.0, 11.5, 4.2, 9.8, 2.5, 7.0];

    // 2. Build the bar chart
    // In a Polar Coordinate system, x-axis maps to the Angle (theta)
    // and y-axis maps to the Radius (r).
    chart!(type1, value)?
        .mark_bar()?
        .encode((
            alt::x("type1"),     // Each category represents a slice of the circle
            alt::y("value"),     // The height of the bar becomes the radius of the slice
            alt::color("type1"), // Distinct colors for each "petal"
        ))?
        .with_y_label("Intensity")
        // CoordSystem::Polar transforms the rectangular bar chart into a Rose Chart
        .with_coord(CoordSystem::Polar)
        .with_grid(true)
        .save("docs/src/images/rose.svg")?;

    Ok(())
}
Nightingale (polar area)
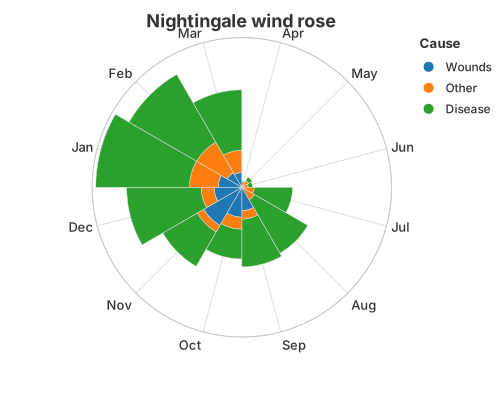
Equal angles, radius proportional to the value — Florence Nightingale's coxcomb.
use charton::prelude::*;
use std::error::Error;

fn main() -> Result<(), Box<dyn Error>> {
    let ds = load_dataset("nightingale")?;
    println!("{:?}", ds);

    chart!(ds)?
        .mark_bar()?
        .encode((
            alt::x("Month"),
            alt::y("Deaths").with_stack("stacked").with_normalize(false),
            alt::color("Cause"),
        ))?
        .with_title("Nightingale wind rose")
        .with_coord(CoordSystem::Polar)
        .with_grid(true)
        .save("docs/src/images/nightingale.svg")?;

    Ok(())
}
See also
- Coordinate Systems — how
CoordSystem::Polarturns Cartesian positions into angles and radii.