1-D Density
A one-dimensional density estimate (a KDE) draws the shape of a numeric column as a smooth curve — the smooth counterpart of a histogram.
mark_density is the convenient way to draw one. It is a composite mark:
behind the scenes it expands into the ordinary recipe
transform_density   // numeric column  →  (value, density)
  → mark_area       // draw the curve
so you can always drop to the pieces. The last section writes the same picture out by hand.
Density plot
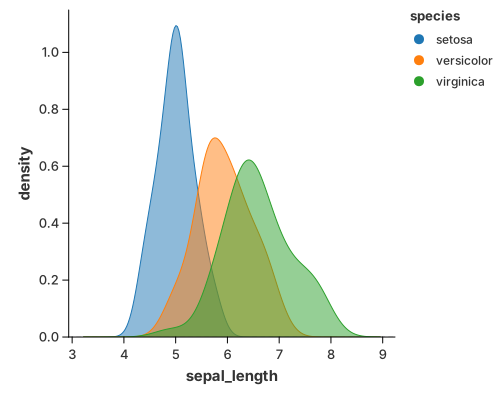
Read the value from x; each color group gets its own curve.
//! Density plot — the convenience `mark_density`.
//!
//! `mark_density` is a **composite** mark: it expands into the public
//! `transform_density` and the shared area geometry. For the composition written
//! out by hand, see `density_manual.rs`. It is the smooth counterpart of a
//! histogram; a violin is the same curve stood upright and mirrored.

use charton::prelude::*;

fn main() -> Result<(), Box<dyn std::error::Error>> {
    let ds = load_dataset("iris")?;

    chart!(ds)?
        .mark_density()?
        .configure_density(|density| density.with_opacity(0.5))
        .encode((alt::x("sepal_length"), alt::color("species")))?
        .save("docs/src/images/density.svg")?;

    Ok(())
}
By default the estimator keeps the tails (trim = false), so the curve fades out
past the last observation — the geom_density look. A violin is the very same
curve stood upright and mirrored; see Violin.
Tuning the curve
Estimating the curve (statistics) and drawing it (geometry) are configured
separately. configure_density forwards the estimator options:
| Method | Meaning |
|---|---|
configure_density(…).with_bandwidth(BandwidthType::Silverman) | smoothing rule (Scott by default) |
.with_kernel(KernelType::Epanechnikov) | smoothing kernel |
.with_trim(true) | stop each curve at its own data range instead of the shared grid |
.with_counts(true) | scale each curve by its group size (counts, not density) |
.with_cumulative(true) | draw the cumulative distribution instead |
.with_color(…), .with_opacity(…), .with_stroke(…) | the area's visual style |
The underlying transform_density replaces the table: it reads the numeric
column and emits (value, density) plus one column per groupby field. See
Transforms & Columns for the full column contract.
Built from the primitives
The same picture without mark_density: transform_density estimates the curve
and mark_area draws it.
//! Density plot — built by hand from the primitives.
//!
//! The same picture as `density.rs`, without `mark_density`. A one-dimensional
//! density estimate (a KDE) draws the shape of a numeric column as a smooth
//! curve: `transform_density` estimates the curve and `mark_area` draws it.
//!
//! ```text
//! transform_density   // numeric column  →  (value, density)
//!   → mark_area       // draw the curve
//! ```

use charton::prelude::*;
use std::error::Error;

fn main() -> Result<(), Box<dyn Error>> {
    let ds = load_dataset("iris")?;

    chart!(ds)?
        .transform_density(
            DensityTransform::new("sepal_length")
                .with_as("sepal_length", "density")
                .with_groupbys(["species"]),
        )?
        .mark_area()?
        .configure_area(|a| a.with_opacity(0.5))
        .encode((
            alt::x("sepal_length"),
            alt::y("density"),
            alt::color("species"),
        ))?
        .save("target/example-output/density_manual.svg")?;

    Ok(())
}
See also
- Composing Your Own — recombining the primitives into new pictures the marks do not cover.
- Violin — the upright, mirrored form, and its grouped/split layouts.
- 2-D Density — two columns at once.
- Cumulative Density — the integral of the curve.