Cumulative Density
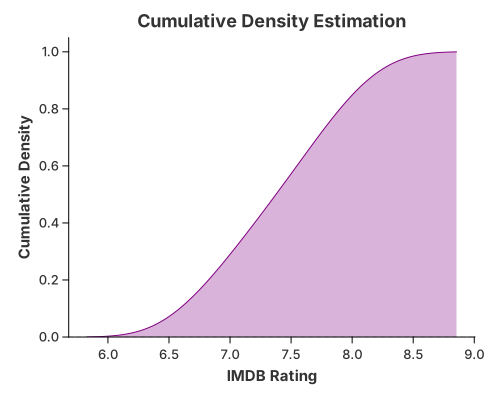
A cumulative density is the integral of a density curve: the share of the data at or below each value. It rises from 0 to 1 and reads the same as an empirical CDF, but is smoothed by the same kernel used for the 1-D density.
mark_density draws it with configure_density(…).with_cumulative(true); behind
the scenes that is still the ordinary recipe
transform_density(cumulative = true)   //  →  (value, cumulative density)
  → mark_area
Cumulative density curve
//! Cumulative density — the convenience `mark_density` with `with_cumulative`.
//!
//! A cumulative density is the integral of a density curve: the share of the
//! data at or below each value. It rises from 0 to 1 and reads like an empirical
//! CDF, but is smoothed by the same kernel used for the 1-D density. For the
//! composition written out by hand, see `distribution_manual.rs`.

use charton::prelude::*;
use std::error::Error;

fn main() -> Result<(), Box<dyn Error>> {
    // Create sample data for demonstration
    let imdb_rating = [
        7.1, 6.8, 7.5, 8.2, 6.9, 7.3, 7.7, 8.0, 6.5, 7.2, 7.9, 6.7, 7.4, 7.8, 8.1, 6.6, 7.0, 7.6,
        8.3, 6.4, 7.2, 7.5, 7.9, 6.8, 7.1, 7.7, 8.0, 6.9, 7.3, 7.6, 7.4, 7.8, 8.2, 6.7, 7.0, 7.5,
        7.9, 6.6, 7.1, 7.7,
    ];
    let genre = [
        "Action", "Drama", "Action", "Comedy", "Drama", "Action", "Comedy", "Drama", "Action",
        "Comedy", "Drama", "Action", "Comedy", "Drama", "Action", "Comedy", "Drama", "Action",
        "Comedy", "Drama", "Action", "Comedy", "Drama", "Action", "Comedy", "Drama", "Action",
        "Comedy", "Drama", "Action", "Comedy", "Drama", "Action", "Comedy", "Drama", "Action",
        "Comedy", "Drama", "Action", "Comedy",
    ];
    let year = [
        2010, 2011, 2010, 2012, 2011, 2010, 2013, 2012, 2011, 2010, 2014, 2013, 2012, 2011, 2010,
        2015, 2014, 2013, 2012, 2011, 2010, 2016, 2015, 2014, 2013, 2012, 2011, 2010, 2017, 2016,
        2015, 2014, 2013, 2012, 2011, 2010, 2018, 2017, 2016, 2015,
    ];

    chart!(imdb_rating, genre, year)?
        .mark_density()?
        .configure_density(|density| {
            density
                .with_cumulative(true)
                .with_color("purple")
                .with_opacity(0.3)
        })
        .encode(alt::x("imdb_rating"))?
        .with_title("Cumulative Density Estimation")
        .with_x_label("IMDB Rating")
        .with_y_label("Cumulative Density")
        .save("docs/src/images/distribution.svg")?;

    Ok(())
}
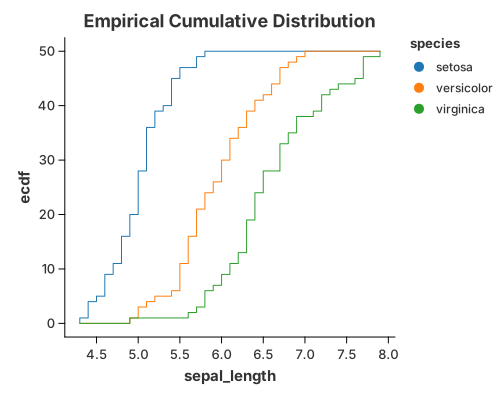
Empirical CDF (cumulative frequency)
When you want the exact, unsmoothed version, use a window CumeDist and draw it
as a step line. No binning or smoothing is involved — every observation is a
step.
use charton::prelude::*;
use std::error::Error;

fn main() -> Result<(), Box<dyn Error>> {
    let ds = load_dataset("iris")?;
    // Create a chart with window transform
    chart!(ds)?
        .transform_window(
            WindowTransform::new(WindowFieldDef::new(
                "sepal_length",
                WindowOnlyOp::CumeDist,
                "ecdf", // This will be the output column name
            ))
            .with_groupbys(["species"])
            .with_normalize(false),
        )?
        .mark_line()?
        .configure_line(|l| l.with_interpolation("step")) // Add step interpolation
        .encode((
            alt::x("sepal_length"),
            alt::y("ecdf"),
            alt::color("species"),
        ))?
        .with_title("Empirical Cumulative Distribution")
        .save("docs/src/images/cumulative_frequency.svg")?;

    Ok(())
}
Both pictures answer "what fraction is below x?", one smooth and one as a step
function. Use transform_window(WindowOnlyOp::CumeDist) for the exact ECDF,
mark_density with with_cumulative(true) for the kernel-smoothed curve.
Built from the primitives
The same picture without mark_density: set .with_cumulative(true) on
DensityTransform and draw the curve with mark_area.
//! Cumulative density — built by hand from the primitives.
//!
//! The same picture as `distribution.rs`, without `mark_density`:
//! `transform_density(cumulative = true)` estimates the curve and `mark_area`
//! draws it.

use charton::prelude::*;
use std::error::Error;

fn main() -> Result<(), Box<dyn Error>> {
    // Create sample data for demonstration
    let imdb_rating = [
        7.1, 6.8, 7.5, 8.2, 6.9, 7.3, 7.7, 8.0, 6.5, 7.2, 7.9, 6.7, 7.4, 7.8, 8.1, 6.6, 7.0, 7.6,
        8.3, 6.4, 7.2, 7.5, 7.9, 6.8, 7.1, 7.7, 8.0, 6.9, 7.3, 7.6, 7.4, 7.8, 8.2, 6.7, 7.0, 7.5,
        7.9, 6.6, 7.1, 7.7,
    ];
    let genre = [
        "Action", "Drama", "Action", "Comedy", "Drama", "Action", "Comedy", "Drama", "Action",
        "Comedy", "Drama", "Action", "Comedy", "Drama", "Action", "Comedy", "Drama", "Action",
        "Comedy", "Drama", "Action", "Comedy", "Drama", "Action", "Comedy", "Drama", "Action",
        "Comedy", "Drama", "Action", "Comedy", "Drama", "Action", "Comedy", "Drama", "Action",
        "Comedy", "Drama", "Action", "Comedy",
    ];
    let year = [
        2010, 2011, 2010, 2012, 2011, 2010, 2013, 2012, 2011, 2010, 2014, 2013, 2012, 2011, 2010,
        2015, 2014, 2013, 2012, 2011, 2010, 2016, 2015, 2014, 2013, 2012, 2011, 2010, 2017, 2016,
        2015, 2014, 2013, 2012, 2011, 2010, 2018, 2017, 2016, 2015,
    ];

    let chart = chart!(imdb_rating, genre, year)?
        .transform_density(
            DensityTransform::new("imdb_rating")
                .with_as("imdb_rating", "cumulative_density")
                .with_cumulative(true),
        )?
        .mark_area()?
        .configure_area(|a| a.with_color("purple").with_opacity(0.3))
        .encode((alt::x("imdb_rating"), alt::y("cumulative_density")))?;

    chart
        .with_title("Cumulative Density Estimation")
        .with_x_label("IMDB Rating")
        .with_y_label("Cumulative Density")
        .save("target/example-output/distribution_manual.svg")?;

    Ok(())
}