Guides: Axis & Legends
In a chart, the data marks (points, lines, bars) are the "what," but the Guides are the "how to read it." Guides act as the translation layer between abstract mathematical scales and human-readable visual cues. In Charton, these are primarily categorized into Axes (which interpret spatial mappings) and Legends (which interpret aesthetic mappings).
The Guide Hierarchy
Following the Grammar of Graphics, Charton treats Axes and Legends as secondary structures that are semantically derived from the primary Encoding specification.
- Axes: Provide spatial context. They map the underlying continuous or discrete
Scaledomain to visual ticks and labels along the dimensions of the plotting area. - Legends: Provide categorical or gradient context. They map aesthetic scales (Color, Shape, Size) back to labeled groups or color ramps.
Axis Generation: From Math to Ticks
The creation of an axis is a multi-step process triggered during the rendering lifecycle:
- Tick Calculation: The system queries the
Scaledomain to determine the ideal intervals. For linear data, it uses a "pretty number" algorithm to ensure labels land on clean integers or decimal fractions. For temporal data, it selects sensible units (e.g., hours, days, or months). - Physical Positioning: Using the
Coordinate System(Cartesian or Polar), the axis generator calculates the pixel location for each tick. In Polar systems, this involves converting radial and angular distances into curved labels. - Rotation & Collision: If labels are long or dense, the system calculates their physical footprint in pixels. If a conflict occurs, the system dynamically rotates labels (e.g., to 45-degree angles) to avoid overlap, ensuring readability.
Each axis also claims a depth — a margin stripped from the plot panel so the axis is not drawn on top of the data:
Field (AxisLayoutConstraints) | Which axis | Measured as |
|---|---|---|
bottom | the bottom x-axis | a height reserved below the panel (tick marks + labels + title) |
left | the left y-axis | a width reserved left of the panel |
Do not confuse depth with length. The x-axis length is the panel width; its depth is bottom. The y-axis length is the panel height; its depth is left. This distinction matters later, because the legend only ever squeezes the panel along its own direction, while the axis depth is a function of the space left over.
Legend Consolidation: The Semantic Bridge
A major architectural feature in Charton is the Semantic Merging of legends. In many visualization libraries, color, shape, and size legends are generated separately, leading to cluttered interfaces. Charton optimizes this:
- Field Mapping: The system scans all aesthetic mappings (Color, Shape, Size) and groups them by their data
Fieldname. - Unified Guide Specs: If
ColorandShapeboth map to the same field (e.g., "Category"), the system merges their definitions into a singleGuideSpec. - Rendering Strategy: The legend renderer then determines the
GuideKind(Legend vs. ColorBar):- Discrete Legend: Used for categorical data. It builds a list of visual symbols (e.g., colored squares, specific shapes) that represent the group.
- ColorBar: Used for continuous gradients. It renders a continuous strip that maps the data domain to a visual color ramp.
The Legend Pipeline
Legend handling is split into three stages, and each stage owns exactly one decision:
GuideManager::collect_guides()      group aesthetics by field        -> Vec<GuideSpec>
        |
LayoutEngine::pack_guides()         measure + wrap (two levels)      -> LegendLayoutPlan
        |
LegendRenderer::render_legend()     add plan offsets to the origin   -> pixels
The renderer is deliberately "dumb": the plan already carries the final position of every block, every entry and every gradient bar, so the renderer only adds origin + offset. Re-deriving layout at draw time is exactly how the measured size and the drawn size drift apart.
Legend Layout Anatomy
A legend is built from two nested levels. The figure below is a real chart -- every box and marker is drawn at coordinates taken from the layout engine itself, not sketched by hand.
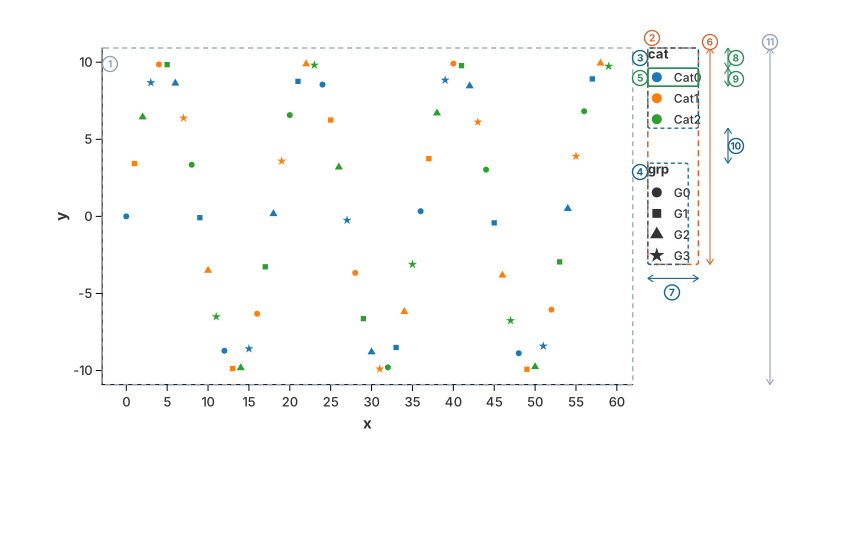
- ①
plot panel-- the area the data is drawn in. Everything the legend needs is measured against this rectangle, not against the whole canvas. - ②
strip-- the resolved legend plan: the bounding box of every block. Its size is what gets reserved as margin around the panel. - ③ ④
block-- one guide. A block contains its own title and all of its entries, so this is the box that is packed against the other blocks. - ⑤
entry-- one row of a legend: the symbol cell, the gap after the symbol, and the label text. It contains no spacing towards its neighbours; the packer adds the gaps. - ⑥
main-- the strip's length along the packing direction. A legend on the left or right edge is packed vertically, somainis a height: 216.4px here. - ⑦
cross-- the thickness across the packing direction (here the block width, 50.6px). It never decides whether something fits; it only decides how far the next column is offset when a run wraps. - ⑧ --
entry.ystarts at 20.2px rather than 0: a block's coordinates begin at its title, and the title strip (13.2px) plus its gap (7px) sit above the first entry. - ⑨ -- the step between two entries: row 18px +
legend_item_v_gap3px. - ⑩ --
legend_block_gap(35px). The second block's offset of 115.2px is the first block's height (80.2px) plus this gap. - ⑪
budget-- how long the strip may become: the panel's extent along the packing direction (336.6px here). The strip (⑥) has to stay within it, otherwise the legend spills over the axis line and covers the tick labels.
Two levels, one algorithm
Both levels -- the entries inside a block, and the blocks inside the strip -- are packed by the
same routine, so an offset always means the same thing: the top-left corner inside my parent. A
block sits at strip origin + block offset, an entry at block origin + entry offset, and the
renderer only ever adds those numbers together.
The direction is chosen once, from the legend position, and both levels obey it:
| Position | Direction | main is | cross is |
|---|---|---|---|
Top, Bottom | Horizontal | width | height |
Left, Right | Vertical | height | width |
Direction::measure(w, h) and Direction::resolve(main, cross) are a plain transpose, which is
why the one packing routine can serve both orientations.
Wrapping and the cursor
The cursor tracks where the next box of the current line begins, which is also how much of the
line is used. A box is placed while its far edge -- cursor + main -- stays inside the budget;
otherwise the run wraps and the next line is offset across the packing direction. The new line
starts after the thickest box of the previous line, never after its last box, so that a thick
box early in a line cannot be overlapped by the next one:
packing direction ->                      a legend with 30 categories, packed vertically
+------------------------------------+
| cat                                |    column 1 holds entries 0..14;
| ● Category 00   ● Category 15      |    the cursor reached 315px, and adding
| ● Category 01   ● Category 16      |    one more entry (18px) would have passed
| ...             ...                |    the budget of 316.4px, so entry 15
| ● Category 14   ● Category 29      |    starts a new column instead
+------------------------------------+
                    ^
   cross offset of column 2 = column width (93.8) + line gap (15) = 108.8
Two properties of the packer are worth stating explicitly, because the rest of the layout depends on them:
- Only
maindecides whether a box fits. A box is oversized only if it is longer than the whole budget on its own; then it is placed anyway, on a line of its own, and simply overflows. Callers that must not overflow have to checkmain_totalafterwards. - A line is as thick as its
max(cross). Wrapping advances by the line's thickest box, socrossnever affects placement inside a line, only where the next line starts.
Measuring one entry
A discrete entry is a single box that is fully determined by the theme and the label text:
|<-- cell=18 -->|<-- marker_text_gap -->|<----- label text ----->|
|      ●       |                       |      Category 00       |
|<------------------- entry main ------------------------------>|
-
cellis a fixed 18px square, so every symbol lines up in one column and every label starts at the same offset regardless of the glyph. -
row = max(18, legend_label_size). The entry's cross extent is always this row height. -
No spacing is baked into the box. The gaps are passed to the packer separately, and they swap with the direction so that lines stay tight while wraps stay readable:
Direction gap(within a line)line_gap(between lines)Horizontallegend_col_h_gaplegend_item_v_gapVerticallegend_item_v_gaplegend_col_h_gap
The budget handed to the entries is the panel's extent along the packing direction, minus the title when the title occupies that axis:
#![allow(unused)]
fn main() {
let entry_budget = match direction {
    Vertical   => (main_budget - title_height - title_gap).max(MIN_ENTRY_BUDGET), // 20px floor
    Horizontal => main_budget,
};
}
Measuring one block
A block is a title strip wrapped around the packed entries. The title is never an entry; it is added afterwards:
#![allow(unused)]
fn main() {
Vertical   => block main  = title_height + title_gap + packed.main_total
Horizontal => block cross = title_height + title_gap + packed.cross_total
width = width.max(estimate_text_width(title, title_height)) // a wide title widens the block
entries[i].y += title_height + title_gap                    // entries already sit below the title
}
title_height = legend_label_size * 1.1 (the title is slightly larger than the labels) and
title_gap = legend_title_gap. This is why the anatomy figure shows entry.y = 20.2px
(13.2 + 7) rather than 0.
Note what the reserved dimension is: for a vertical legend the height is the length along the packing direction and the width is the cross dimension. The strip reserves the cross thickness. The legend is not allowed to grow arbitrarily long; it must fit the panel it sits next to, and when it does not, it wraps and gets thicker. So the space taken from the panel is the result of wrapping, not an arbitrary demand.
Colour bars
A colour bar has no discrete entries, so it is measured from the budget directly:
| Direction | Length | Thickness |
|---|---|---|
Horizontal | main_budget.clamp(150, 300) | 15px |
Vertical | (main_budget * 0.7).min(200) | 15px |
Its tick labels sit under a horizontal bar and beside a vertical one, so the block's cross size is
thickness + padding + font in the first case and thickness + legend_marker_text_gap + max_label_width in the second. The tick set (colorbar_ticks) is shared by measurement and
rendering, so the widest label that was reserved for is the one that gets drawn.
Layout-Aware Rendering
Guides are not independent objects; they are aware of the chart's total physical constraints.
- Space Reservation: The layout engine asks the guides how much room they need and turns that into bands around the plot panel. A legend may never be longer than the panel it sits next to; that is the rule which keeps a long legend from covering the axis labels. The bands and the reservation loop are described in Space Manager.
- Anchoring: A guide is drawn inside the exact band that was reserved for it, so the reserved space and the drawn position always agree.
- Drawing verbatim: The resolved plan carries the final position of every block, every entry and every gradient bar. Renderers draw those numbers as they are instead of re-deriving them, which is what guarantees that the drawn legend matches the space reserved for it.
Why Consolidation Matters
The automated generation of these guides provides three core advantages:
- Mathematical Integrity: Because guides are generated directly from the resolved global scales, the labels are guaranteed to match the data precisely. You never have to manually update a label when the data changes.
- Reduced Visual Noise: By merging multiple aesthetics into a single legend block, the chart keeps the viewer's focus on the data, not on redundant interface elements.
- Automated Layout: Because the layout manager is aware of guide requirements, you don't need to manually configure margins. The chart automatically adjusts to accommodate the font sizes and number of categories present in your specific dataset.
Formatting Labels
By default Charton derives every label from the scale: pretty numbers with
scientific notation for axes, category names for legends. Production charts
routinely need more, so LabelFormat is the one builder for all of it:
currency prefixes, compact notation, fixed precision, thousands separators, or
an entirely custom string.
#![allow(unused)]
fn main() {
use charton::prelude::*;

let money = LabelFormat::new()
    .with_prefix("$")
    .with_compact_notation() // 20_000_000_000 -> 20B
    .with_precision(0);

chart!(year, investment)?
    .mark_line()?
    .encode((alt::x("year"), alt::y("investment"), alt::color("area")))?
    .with_y_label_format(money.clone())   // axis ticks
    .with_legend_label_format(money)      // legend entries / colour bar
    .to_svg()?;
}
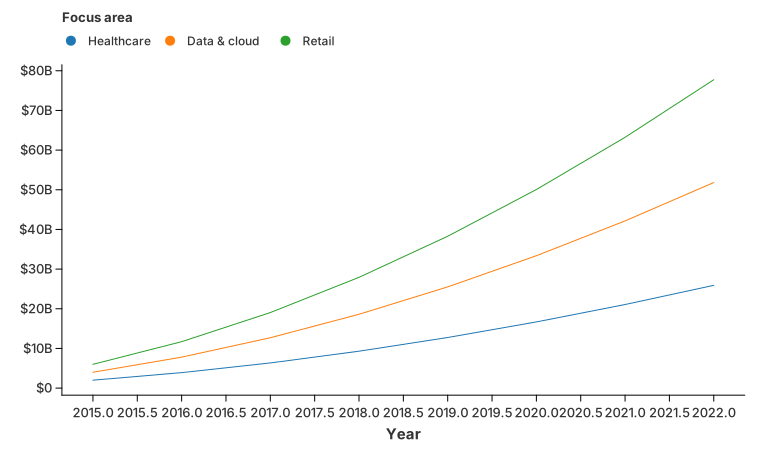
Three setters exist: with_x_label_format, with_y_label_format and
with_legend_label_format. The legend title is renamed with
with_color_label / with_shape_label / with_size_label, and the legend is
hidden completely with configure_theme(|t| t.with_show_legend(false)) (or
LegendPosition::None).
One formatting pass, at the scale
The formatter is applied by decorating the scale in a FormattedScale, not by
patching strings after the fact. That single decision is what keeps the guide
machinery self-consistent:
- Every consumer of the scale -- the axis renderer, the grid, the colour bar, and the layout engine that measures how much room the labels need -- sees the same strings. A formatted label that is wider than the raw one therefore reserves exactly the space it later occupies.
- Guide code must not re-derive labels. When a scale carries a formatter,
ScaleTrait::label_formatterreturnsSome, and the guide's decimal alignment pass (get_sampling_labels/get_sampling_ticks) returns the scale's labels untouched. - Visual mappings still key on the raw category values. The legend keeps a separate list of unformatted lookup labels, so uppercasing a legend label never changes which colour a category resolves to.
Escaping to arbitrary text
When the built-in options are not enough, hand the scale a closure:
#![allow(unused)]
fn main() {
// Continuous values
let custom = LabelFormat::new()
    .with_numeric_formatter(|value| format!("{:.1}%", value * 100.0));

// Categorical values
let custom = LabelFormat::new()
    .with_text_formatter(|label| label.replace('_', " "));
}
The closure produces the core text; with_prefix / with_suffix still apply
around it.
Key Takeaways
Axes map space; Legends map aesthetics.
- Guides are derived: They are not manually created, but are inferred directly from the Encoding and Scale specifications.
- Semantic Merging: Multiple aesthetics mapping to the same field are consolidated into a single guide to minimize visual clutter.
- Two levels, one packer: entries are packed into blocks, blocks into the strip, by the same flex-wrap routine in a
main/crossframe. - Layout Awareness: Guides communicate their size requirements to the layout engine, and the panel, the axes and the legends are resolved together by a short fixed-point loop.
- Known limitation: that loop is a fixed-point iteration over quantised values and is not guaranteed to converge; a rare period-2 oscillation can leave the legend layout one column off and flip it as the canvas is resized.